
What Is Median in Math
The median in math is the middle value in a set of numbers when the data is arranged in numerical order from smallest to largest. It is one of the most important measures of central tendency used in mathematics and statistics to describe the center of a dataset. The median helps identify the value that divides the dataset into two equal halves, meaning that half of the numbers are smaller than the median and the other half are larger.
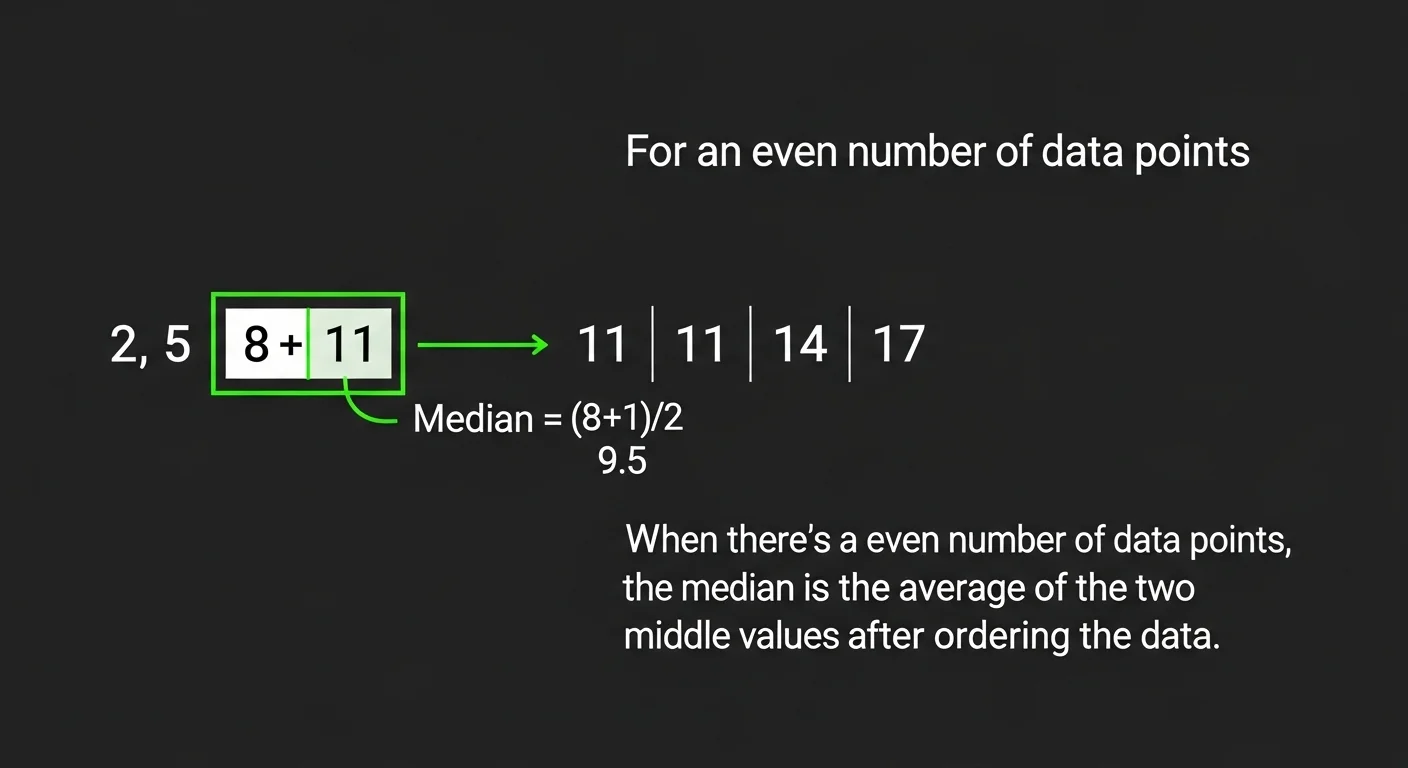
To find the median, you first arrange all numbers in ascending order. If the dataset contains an odd number of values, the median is the middle number. If the dataset contains an even number of values, the median is calculated by finding the average of the two middle numbers. For example, in the dataset 3, 7, 9, 12, 15, the median is 9 because it lies exactly in the center. In another example with an even number of values like 4, 6, 8, 10, the median would be (6 + 8) ÷ 2 = 7. The median is especially useful when dealing with data that includes extreme values or outliers because it provides a more accurate representation of the center than the mean.
Median and Mode Meaning in Math
The median and mode meaning in math refers to two important statistical measures used to analyze and summarize numerical data. Both the median and mode help describe the central tendency of a dataset, which means they help identify typical or common values within a group of numbers.
The median is the middle value in an ordered dataset, while the mode is the number that appears most frequently in the dataset. For example, in the dataset 2, 4, 4, 5, 7, the median is 4 because it is the middle value, and the mode is also 4 because it appears more times than any other number. These measures are commonly used in statistics, economics, education, and research to understand patterns in data. While the median focuses on the position of values, the mode focuses on frequency, making both measures useful for analyzing different types of datasets.
Mode Meaning in Math Example
The mode in math is the value that appears most frequently in a dataset. It is another measure of central tendency used to understand which number occurs the most within a group of values. Unlike the mean and median, the mode focuses on frequency rather than the average or middle position.
For example, consider the dataset 3, 5, 5, 7, 8, 9. In this case, the number 5 appears twice, while the other numbers appear only once. Therefore, the mode is 5 because it occurs more frequently than any other value. In some datasets, there may be more than one mode. For instance, in the dataset 2, 4, 4, 6, 6, 8, both 4 and 6 appear twice, making the dataset bimodal. If no number repeats, then the dataset has no mode. The mode is commonly used in statistics, market research, and surveys to identify the most common or popular value in a dataset.
Mode Formula
The mode formula in mathematics refers to the method used to identify the most frequently occurring value in a dataset. Unlike the mean and median, the mode does not always require a mathematical calculation because it is determined by observing which number appears the most times.
For simple datasets, finding the mode involves counting the frequency of each value and identifying the number that occurs most often. In grouped data used in statistics, a formula may be used to estimate the mode. The formula for the mode in grouped frequency distributions is:
Mode = L + [(f1 − f0) / (2f1 − f0 − f2)] × h
In this formula, L represents the lower limit of the modal class, f1 is the frequency of the modal class, f0 is the frequency of the class before the modal class, f2 is the frequency of the class after the modal class, and h is the class width. This formula helps estimate the mode when dealing with large datasets grouped into intervals.
What Is the Mean in Math
The mean in math is the average value of a set of numbers and is one of the most commonly used measures of central tendency. It is calculated by adding all the numbers in a dataset and then dividing the total by the number of values. The mean helps summarize data by representing the overall average.
For example, if you have the numbers 5, 10, 15, and 20, you first add them together:
5 + 10 + 15 + 20 = 50.
Then divide by the number of values, which is 4.
50 ÷ 4 = 12.5.
Therefore, the mean of the dataset is 12.5. The mean is widely used in mathematics, statistics, economics, and everyday life to analyze data such as exam scores, temperatures, and financial averages. However, it can sometimes be affected by extremely large or small values known as outliers.
Mean, Median Mode
Mean, median, and mode are the three primary measures of central tendency used in mathematics and statistics to describe the central point of a dataset. These measures help summarize large sets of data into a single value that represents the typical value within the dataset.
The mean is the average obtained by adding all numbers and dividing by the total number of values. The median is the middle value when numbers are arranged in order, and the mode is the value that appears most frequently. Each measure provides different insights into the data. For example, the mean gives an overall average, the median shows the central position of values, and the mode identifies the most common value. Together, these measures are widely used in fields such as research, data analysis, economics, and education.
Mean, Median Mode Formula
The mean, median mode formula refers to the mathematical methods used to calculate the three measures of central tendency in statistics and mathematics. These formulas help analyze numerical data and identify the center of a dataset.
The formula for the mean is:
Mean = (Sum of all values) ÷ (Number of values)
The median is calculated by arranging numbers in ascending order and identifying the middle value. If the dataset contains an even number of values, the median is calculated as:
Median = (Middle value 1 + Middle value 2) ÷ 2
The mode is determined by identifying the number that appears most frequently in the dataset. In statistics, there is also an empirical relationship between these measures:
Mode = 3 × Median − 2 × Mean
These formulas are fundamental tools in statistics and are commonly used for analyzing data in research, science, economics, and many other fields.
What Is Mode in Statistics
The mode in statistics is the value that appears most frequently in a dataset. It is a key measure of central tendency used to identify the most common observation in a group of numbers or data points. The mode is especially useful when analyzing categorical or discrete data because it highlights the most typical or repeated value.
For example, in the dataset 1, 2, 2, 3, 4, 5, the number 2 appears more frequently than any other value, so the mode is 2. In statistics, datasets can have one mode (unimodal), two modes (bimodal), or more than two modes (multimodal). Some datasets may also have no mode if no value repeats.
The mode is widely used in statistical analysis, surveys, and market research to determine the most common responses or outcomes. By identifying the most frequent value, statisticians and researchers can better understand patterns and trends within a dataset.
What Does “Mode” Mean in Math?
In math, mode is one of the measures of central tendency, which is a fancy way of saying it tells you something “typical” about a set of numbers. Specifically:
Definition: The mode is the number that appears most frequently in a data set.
Key Feature: Unlike mean (average) or median (middle value), the mode focuses on frequency.
Different Meanings Based on Context
While mode usually refers to the most frequent number, it can have slightly different interpretations depending on context:
Single Mode (Unimodal): Only one number occurs most often.
Multiple Modes (Bimodal/Multimodal): Two or more numbers occur with equal highest frequency.
No Mode: If all numbers appear with the same frequency, some teachers or texts say the data set has no mode.
A Quick History
The concept of mode has been around since the 19th century when statisticians needed a simple way to describe “typical” values in data sets. It has since become a standard part of statistics, probability, and data analysis, especially in schools.
How People Use “Mode” in Real Math Problems
Mode is everywhere in math classrooms, standardized tests, and real-world situations. Here’s where you’re likely to see it:
Classroom Assignments: Teachers often ask for the mode when analyzing small sets of numbers.
Data Surveys: Mode helps understand the most popular option in polls or questionnaires.
Business and Marketing: Companies use mode to see the most common customer choice.
Sports Analytics: The mode can show the most frequent score or performance metric.
When Mode Is Useful vs. Misleading
Useful:
Quickly identifies the most common value in a data set.
Works well with categorical data (like favorite colors or brands).
Potentially Misleading:
In highly varied data sets, the mode might not represent overall trends.
Rarely used alone; usually combined with mean and median for a complete picture.
Real-Life Examples of Mode in Math
Seeing mode in action makes it much easier to understand. Here are some examples:
Example 1: Test Scores
Scores: 80, 85, 85, 90, 95
Mode = 85 (it appears twice, more than any other number)
Example 2: Favorite Ice Cream Flavors
Vanilla, Chocolate, Strawberry, Chocolate, Vanilla, Chocolate
Mode = Chocolate (most popular flavor)
Example 3: Number of Pets
0, 1, 1, 2, 3, 3
Modes = 1 and 3 (bimodal, because both appear twice)
Example 4: Survey Ratings
Ratings: 5, 4, 4, 3, 5, 5
Mode = 5 (most frequent rating, shows popularity)
Example 5: Shoe Sizes
Sizes: 7, 8, 9, 7, 10, 7, 8
Mode = 7 (most common shoe size among the group)
Each of these examples shows how mode helps identify what is “most typical” in a data set.
Common Mistakes & Misunderstandings
Even seasoned students sometimes mix up the mode with other measures. Here are common pitfalls:
Confusing Mode with Mean or Median: Mode is about frequency, not average or middle value.
Ignoring Multiple Modes: Some think a data set can have only one mode.
Misapplying Mode to Non-Frequent Data: If all numbers appear once, reporting a mode is misleading.
Categorical Misinterpretation: Mode works for numbers and categories, but some forget this.
Related Terms & Abbreviations in Math
If you’re learning mode, you’ll likely bump into these related terms:
Mean: The average of a data set.
Median: The middle value when numbers are arranged in order.
Frequency: How many times a number appears.
Range: The difference between the largest and smallest numbers.
Bimodal/Multimodal: Data sets with two or more modes.
These terms often appear together in statistics lessons, so understanding mode gives you a foundation for the others.